Driver-based planning has become the standard forecasting methodology for high-performing FP&A teams. Instead of copying last year’s budget and applying a blanket growth rate, driver-based models connect financial outcomes directly to measurable business inputs.
This guide explains what driver-based planning is, why it matters, and how to implement it step by step.
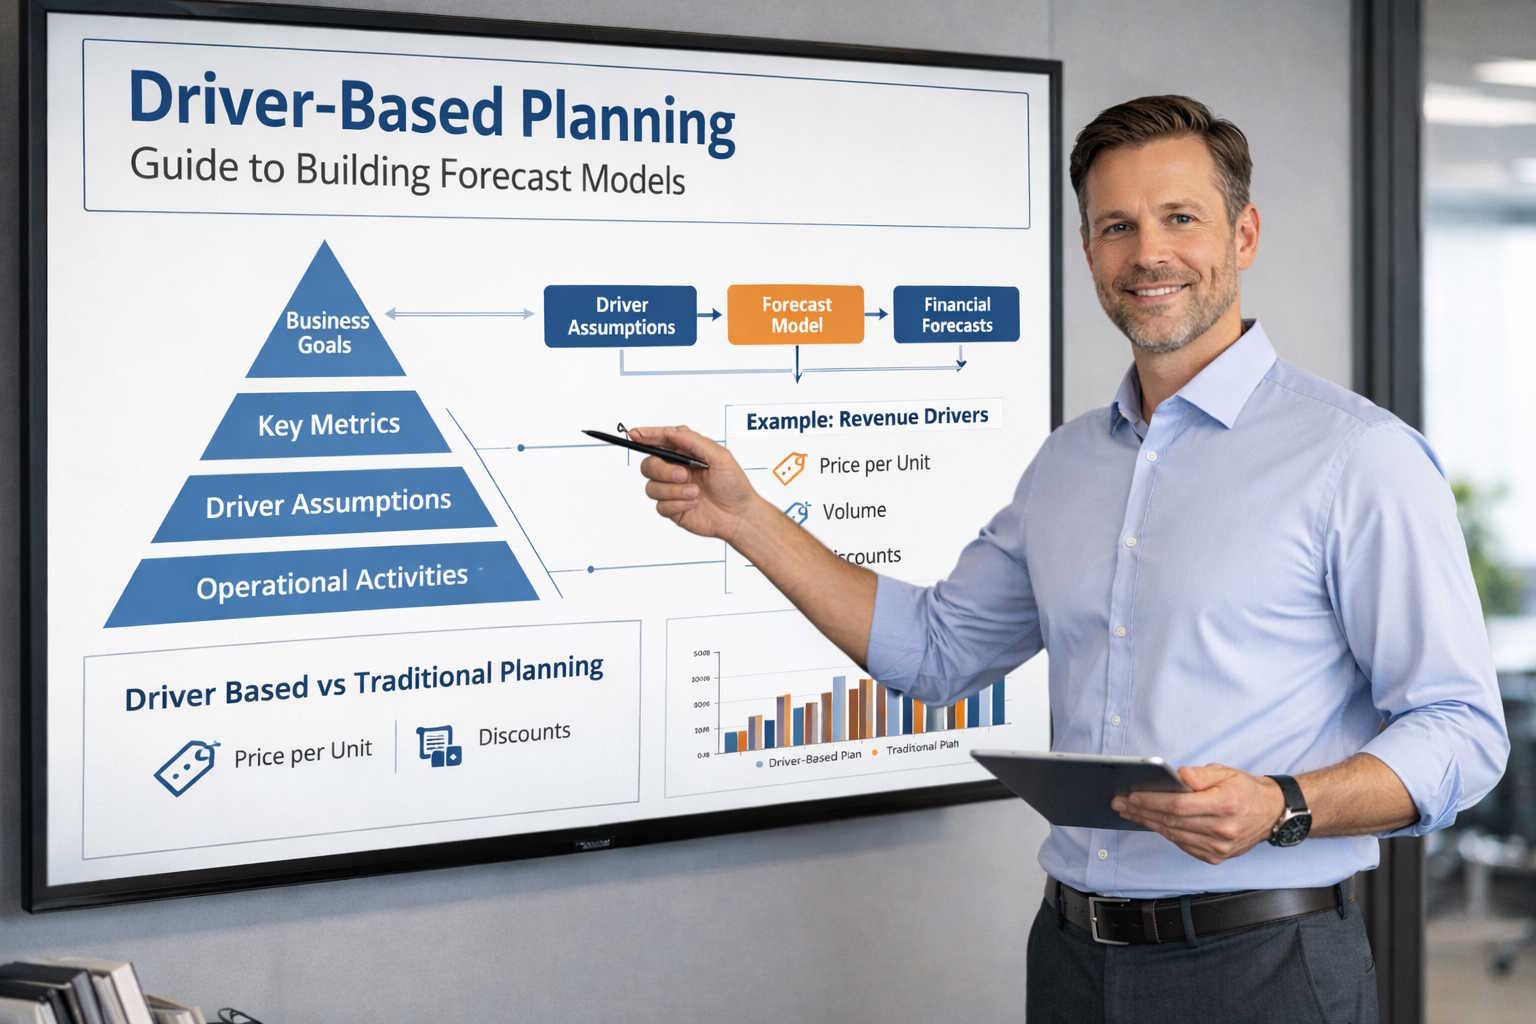
What Is Driver-Based Planning?
Driver-based planning is a forecasting method where every line in your financial model is derived from one or more operational drivers—measurable business variables that cause financial outcomes to change.
For example, instead of forecasting revenue as “last year + 15%,” a driver-based model calculates revenue as:
Revenue = Number of Deals Closed × Average Contract Value × Renewal Rate
Each of those inputs is a driver that the business can measure, influence, and discuss.
Why It Matters
- Transparency: Stakeholders can see exactly which assumptions produce a given forecast.
- Agility: When conditions change, you update one or two drivers instead of rebuilding the entire model.
- Scenario analysis: You can quickly model best-case, base-case, and downside scenarios by toggling driver values.
- Accountability: Business owners can own specific driver targets (e.g., “marketing owns MQL volume; sales owns win rate”).
Identifying the Right Drivers
Not every metric qualifies as a planning driver. Good drivers share three characteristics:
- Measurable: You can track the driver reliably with existing data.
- Controllable: Someone in the organization can influence the driver through operational decisions.
- Material: A reasonable change in the driver produces a meaningful change in financial outcomes.
Common Drivers by Function
| Function | Example Drivers |
|---|---|
| Sales | Pipeline volume, win rate, average deal size, sales cycle length |
| Marketing | MQLs, cost per lead, conversion rate, paid spend |
| Customer Success | Gross retention, net retention, expansion ACV, churn rate |
| Engineering | Headcount, cost per engineer, contractor mix, capitalization rate |
| G&A | Headcount, facilities cost per seat, software cost per employee |
Building a Driver-Based Model: Step by Step
Step 1: Map Your Revenue Model
Start with revenue because it cascades into the rest of the P&L. Break revenue into its component parts. For a B2B SaaS company, a typical decomposition looks like this:
- New ARR = New deals × ACV
- Expansion ARR = Existing customers × upsell rate × expansion ACV
- Churned ARR = Beginning ARR × gross churn rate
- Ending ARR = Beginning ARR + New ARR + Expansion ARR − Churned ARR
Step 2: Model Headcount and Compensation
Headcount is the single largest cost driver for most companies. Build a headcount plan that specifies:
- Department and role
- Start date (hire month)
- Fully loaded cost (base salary + benefits + taxes + equity)
- Ramp time (especially for quota-carrying roles)
Step 3: Connect Operating Expenses to Drivers
Map every material expense line to its driver:
- Hosting costs → Driven by customer count or data usage
- Travel & entertainment → Driven by headcount and travel frequency assumptions
- Software licenses → Driven by headcount × cost per seat
- Recruiting costs → Driven by number of hires × cost per hire
Step 4: Build Scenario Toggles
Create a dedicated assumptions tab in your model where leadership can toggle key drivers. At minimum, build three scenarios:
| Scenario | Revenue Growth | Hiring Pace | Churn |
|---|---|---|---|
| Upside | +25% YoY | Aggressive | −0.5% improvement |
| Base | +18% YoY | Planned | Flat |
| Downside | +8% YoY | Freeze net-new | +1% deterioration |
Step 5: Validate Against Actuals
Once you have a month of actuals, compare forecasted driver values against observed data. This is where driver-based models shine: instead of just seeing that revenue missed by $200K, you can trace the miss to a specific driver (e.g., win rate dropped from 28% to 22%).
Common Mistakes to Avoid
- Too many drivers: A model with 50 drivers is not more accurate—it is just harder to maintain. Focus on the 10-15 drivers that explain 80%+ of your financial outcomes.
- Stale assumptions: Update driver values monthly with actuals. A quarterly refresh is not frequent enough for fast-moving businesses.
- Ignoring leading indicators: Lagging drivers (like recognized revenue) are useful for reporting but not for planning. Prioritize leading indicators like pipeline and bookings.
- No ownership map: Every driver should have a named business owner. If nobody owns it, nobody will forecast it accurately.
Implementing Driver-Based Planning at Scale
For teams managing driver-based models in spreadsheets, complexity eventually forces a platform decision. Here is a practical progression:
- Seed stage / small team: Excel or Google Sheets with a well-structured workbook.
- Growth stage (50-200 employees): Migrate to a lightweight planning tool (Pigment, Mosaic, Runway) that connects to your GL and HRIS.
- Scale stage (200+ employees): Enterprise platforms like Anaplan or Adaptive Planning offer multi-dimensional modeling, workflow, and auditability.
Regardless of tool choice, the modeling principles remain the same: keep drivers visible, scenarios toggleable, and ownership clear.
Key Takeaways
Driver-based planning replaces opaque, static budgets with transparent, flexible models that FP&A teams can update in real time. By identifying the right drivers, mapping them to financial outcomes, and building scenario toggles, you create forecasts that leadership can actually trust and act on.
The best time to start is now—even a simplified driver-based model in Excel is better than a line-item budget that nobody believes.